5.1 Dashboard
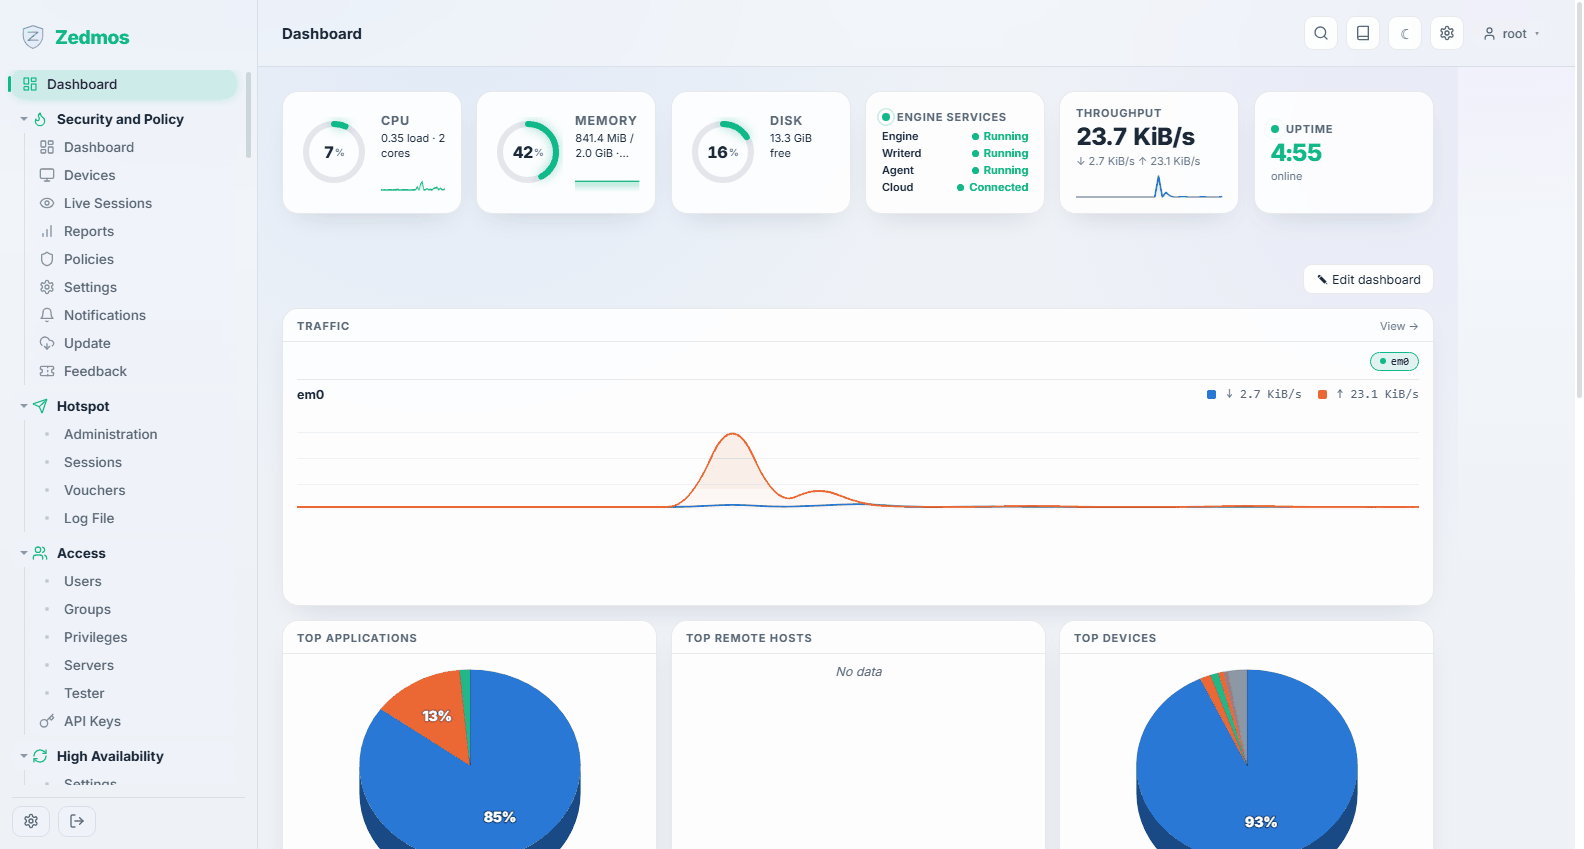
/ — the page you land on after signing in.
The fixed row
The row of cards along the top is always there and cannot be removed. It is the appliance's vital signs:
| Card | Reads |
|---|---|
| CPU | Load average and core count, with a short history line. |
| Memory | Used against total. On ZFS systems the cache is not counted as "used" — a box that looks 77 % full in top is usually mostly cache. |
| Disk | Free space on the system disk. Watch this if you keep packet captures or long log retention. |
| Engine services or Firewall | With the security engine installed: the four processes it depends on — Engine, Writerd, Agent and the Cloud link — each green when running and red when not. Without the engine, the same slot shows the firewall's pf state count. |
| Throughput | Current up and down rate across the interfaces, with a live sparkline. |
| Uptime | How long the appliance has been up. |
The board
Everything below the fixed row is yours to arrange. Edit dashboard turns on drag-and-drop: drag a card by its header to move it, drag its corner to resize, and use the ✕ on a card to take it off the board. Appearance → Dashboard widgets is the same board expressed as a checklist — tick a widget to put it on, untick to take it off.
The board belongs to the appliance, not to your browser. Two administrators see the same board, and it survives a browser change, a new laptop and a firmware update.
Widgets available out of the box:
| Widget | Shows |
|---|---|
| Traffic | Per-interface throughput over time, with a legend you can click to isolate one interface. |
| System Information | Product, version, hostname, uptime — what you read out to support. |
| Resources | A compact repeat of load, memory and disk for at-a-glance reading. |
| Interfaces | Each interface with its link state and address. |
| Interface Statistics | Packet and byte counters per interface, including errors — where you notice a failing cable or a duplex mismatch. |
| Gateways | Each gateway's state and round-trip time. |
| Firewall rule hits | Which rules are actually matching traffic — the fastest way to see whether the rule you wrote is being used. |
| Services | Which services are running, with start/stop/restart in place. |
| Firmware | The installed version and whether an update is waiting. |
| Certificates | Every certificate in the trust store with its subject and how long it has left, soonest expiry first. |
| DHCP Leases | Who currently holds an address. |
| Notes | A free-text note that stays on the appliance — handy for "this box is the branch office spare, serial 1234". |
With the security engine installed, its cards appear here as widgets too: Feature Status (which capabilities are active), Top Threats, Top Remote Hosts, Top Applications, Top Devices, Engine, Writerd & Database and Cloud Agent. They read live data from the engine; on a box where the engine is installed but not yet configured they honestly say so rather than showing zeros.
A widget that says "No data" is usually telling the truth. Top Applications is empty until the engine has seen traffic; Firewall rule hits is empty until rules match. Check the matching status page before assuming the widget is broken.